今天来翻译一篇文章,是关于高效使用GDB调试的。
建议一:Try GDB Dashboard
这可能不是你喜欢的“菜”,但像我这样的,喜欢在每一个断点处获得更多的程序信息,所以就尝试GDB仪表板。
它是一款非常棒的组合式的界面,看起来是这样的:
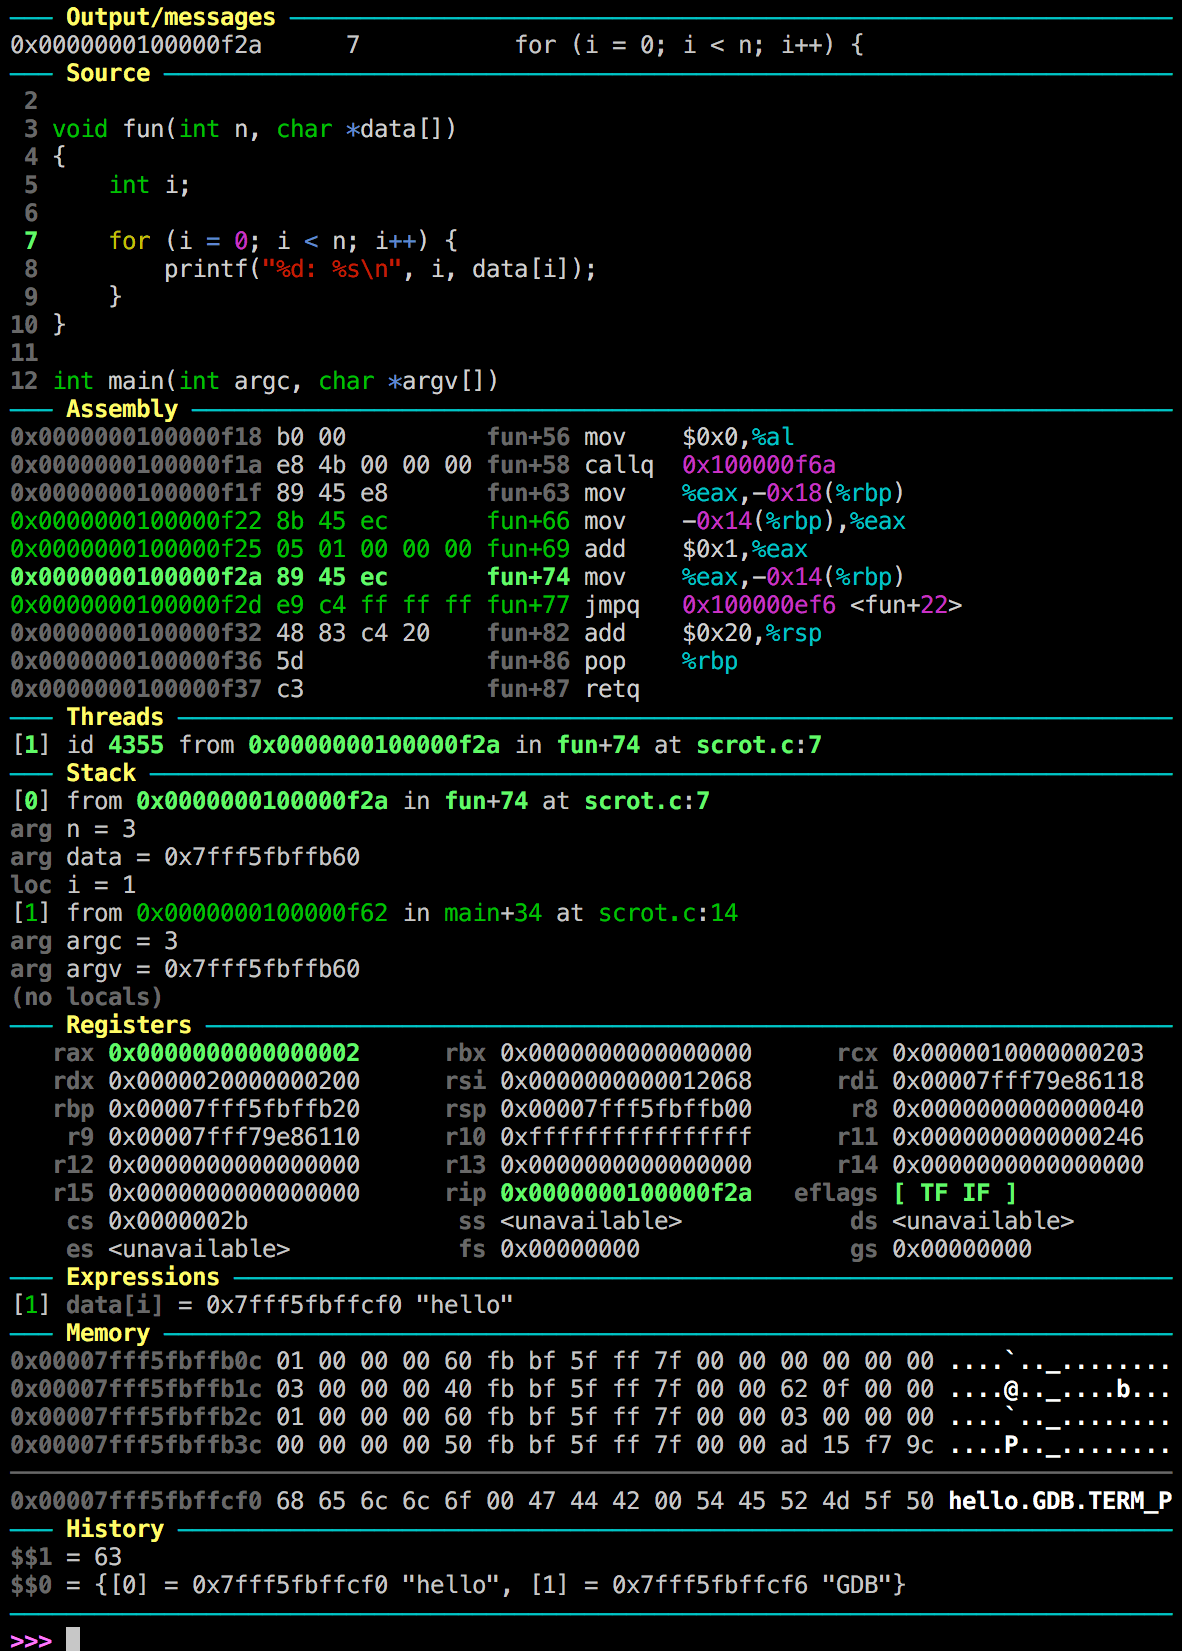
从Github仓库(https://github.com/cyrus-and/gdb-dashboard),能够获取该项目的更多信息,根据你的需求定制你自己的样式。
建议二:Use a global .gdbinit and a project .gdbinit
.gdbinit是一个配置文件,在gdb启动的时候生效。在你的home目录(~/.gdbinit)可以有一个配置文件做全局设置,或者在当前项目目录 (./.gdbinit)下特定配置。
正如你从下面的提示可以看到,项目中配置.gdbinit对gdb设定自定格式或者别名是非常有效的。
提示:必须用set auto-load local-gdbinit让项目生成.gdbinit文件!
通常C/C++如果使用了联合体(unions),在调试器中很难检查的。
为了让他们更加可读,你可以为你的数据类型设定自定义的格式。参见GDB的Pretty Prining(https://sourceware.org/gdb/onlinedocs/gdb/Pretty-Printing.html#Pretty-Printing)
举个例子,在Rival Fortress中有一个矩阵的数据类型(MPEMatrix4),那是许多匿名结构(anonymous structs)的一个联合体(union)。这样使用就是为了方便。
使用了自定义打印格式,前后对比效果如下:
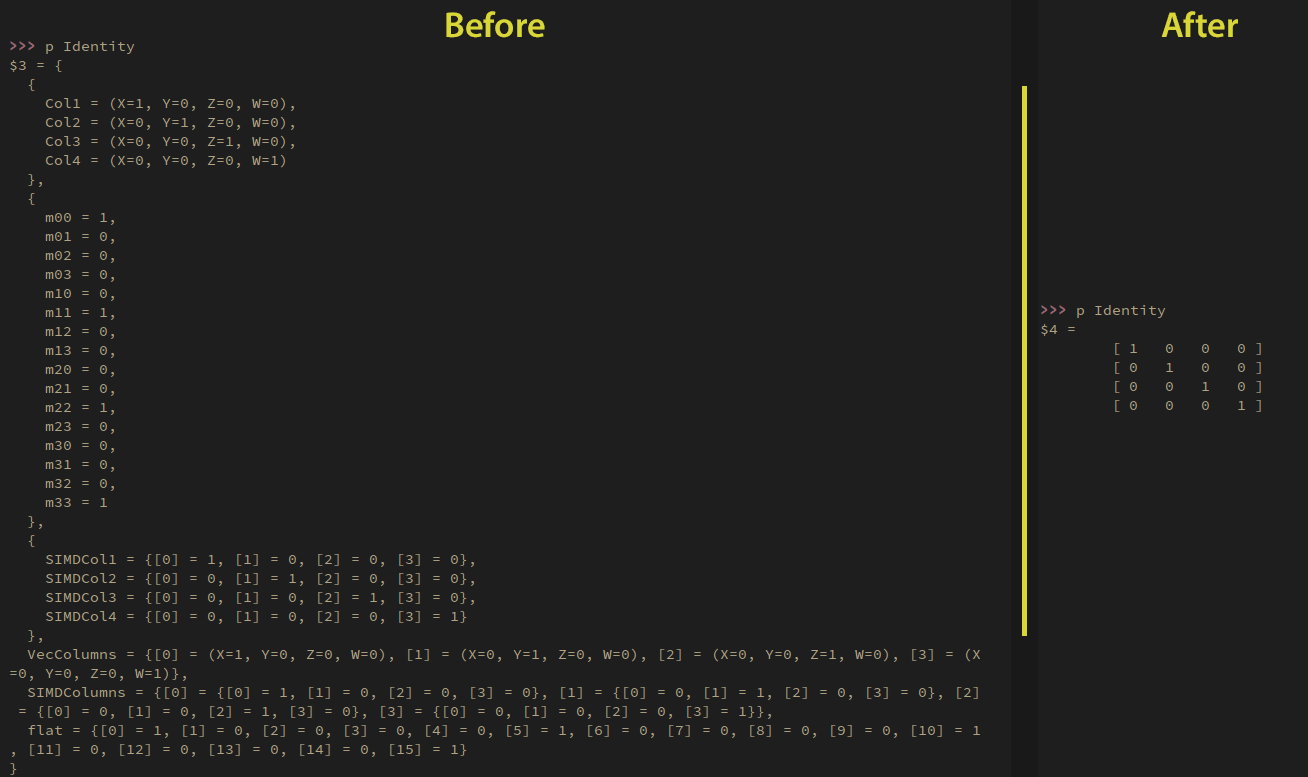
自定义的格式的源码如下:
1 2 3 4 5 6 7 8 9 10 11 12 13 14 15 16 17 18 19 20 21 22 23 24 25 26 27
| class MPEMatrixPrinter: """Print a 4x4 matrix.""" def __init__(self, val, size): self.val = val self.size = int(size) def to_string(self): return ("\n\t[ %3g %3g %3g %3g ]" "\n\t[ %3g %3g %3g %3g ]" "\n\t[ %3g %3g %3g %3g ]" "\n\t[ %3g %3g %3g %3g ]") % \ (float(self.val["flat"][0]), float(self.val["flat"][1]), float(self.val["flat"][2]), float(self.val["flat"][3]), float(self.val["flat"][4]), float(self.val["flat"][5]), float(self.val["flat"][6]), float(self.val["flat"][7]), float(self.val["flat"][8]), float(self.val["flat"][9]), float(self.val["flat"][10]), float(self.val["flat"][11]), float(self.val["flat"][12]), float(self.val["flat"][13]), float(self.val["flat"][14]), float(self.val["flat"][15])) def project_type_lookups(val): lookup_tag = val.type.tag if lookup_tag == None: return None match = re.match(r"^MPEMatrix(\d)$", lookup_tag) if match: return MPEMatrixPrinter(val, match.group(1)) gdb.pretty_printers.append(project_type_lookups)
|
建议四:Use aliases
别名能够非常有效地提高调试的效率,在.gdbinit文件这样设置:
1
| alias -a w = dashboard expression watch
|
建议五:Use automatic $ variables
不管什么时候,使用print命令检查某些东西,gdb会像这样在一个变量里自动存储结果:
1 2 3 4 5 6
| >>> print Identity $1 = [ 1 0 0 0 ] [ 0 1 0 0 ] [ 0 0 1 0 ] [ 0 0 0 1 ]
|
$1是自动生成的变量,在后面也可这样提取他:
1 2 3 4 5 6
| >>> print $1 $2 = [ 1 0 0 0 ] [ 0 1 0 0 ] [ 0 0 1 0 ] [ 0 0 0 1 ]
|
建议六:Inspect array pointers
在一个数组里面使用C-style的指针,可以使用下面的命令:
将会打印Array中的10个元素。
建议七:Enable command history
设置命令历史记录,在.gdbinit文件中设置:
在当前目录下默认保存的历史文件(.gdb_history),但是可以设定输出文件名:
1
| set history filename <fname>
|
建议八:Detect if the debugger is running
这个其实不是关于gdb调试,但是非常的有用。
在windows系统里可以使用IsDebuggerPresent(https://msdn.microsoft.com/en-us/library/windows/desktop/ms680345(v=vs.85).aspx)函数来判断debugger是否在运行。
在Unix系统也是可以这样使用的:
1 2 3 4 5 6 7 8 9 10 11 12 13 14
| #ifndef _WIN32 #include <sys/ptrace.h> static int IsDebuggerPresent() { static int Detected; static int RunningUnderDebugger; if (!Detected) { Detected = 1; RunningUnderDebugger = ptrace(PTRACE_TRACEME, 0, 0, 0) == -1; } return RunningUnderDebugger; } #endif
|